Hand Hygiene Auto Report Template
Do you spend a lot of time cutting and pasting charts into PowerPoint to create unique reports for different stakeholders? With Semmel’s Report Template feature, this will be the thing of the past. With Report Template feature, you can
- generate pre-set stakeholder reports with the click of a button. This is called Manual Reporting.
- instruct the system to auto generate stakeholder reports on specific day each month and also automatically send the reports to each stakeholder. This is called Auto Reporting.
Note: Report Templates is not available for Cluster accounts.
Foundation Set Up
Step 1: Go to Reports Module.

Step 2: Click on Report Template Menu.

Step 3: Click Add template.
Give the template a Title and Description.
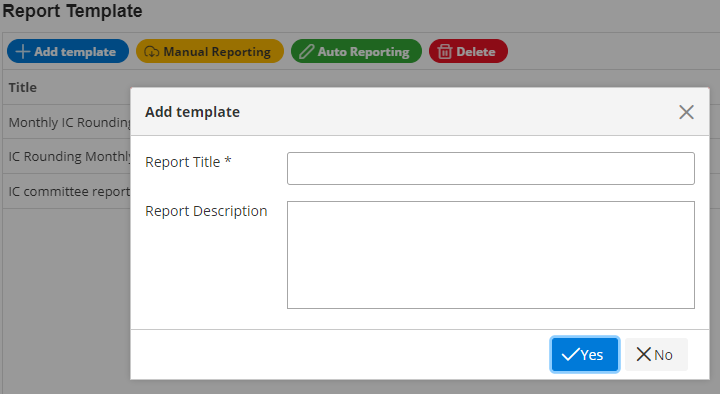
Step 4: Pick your charts and add it into the Report Template.
- Click any charts listed in the Compliance Reports menu.
- Use filters to select the chart detail. If you want a report only for a particular audit site, then select the audit site in the Location filter. Only these filters will be applied in the report: Location, Location Group, Profession, Profession Group and Moments. Use a combination of available filters to generate a report that you need. For example, to generate an Audit Site Compliance report for Doctor profession who visits the ICU department, then select Doctor and ICU in the Professions and Location filter respectively.
- Click the blue “+” icon to launch a list of available Templates. Then select the intended Template to add the chart (together with the applied filters) to that Template. You will see a Success message each time a report is added to a template.
- Repeat the steps to add as many charts as you like to a Template.
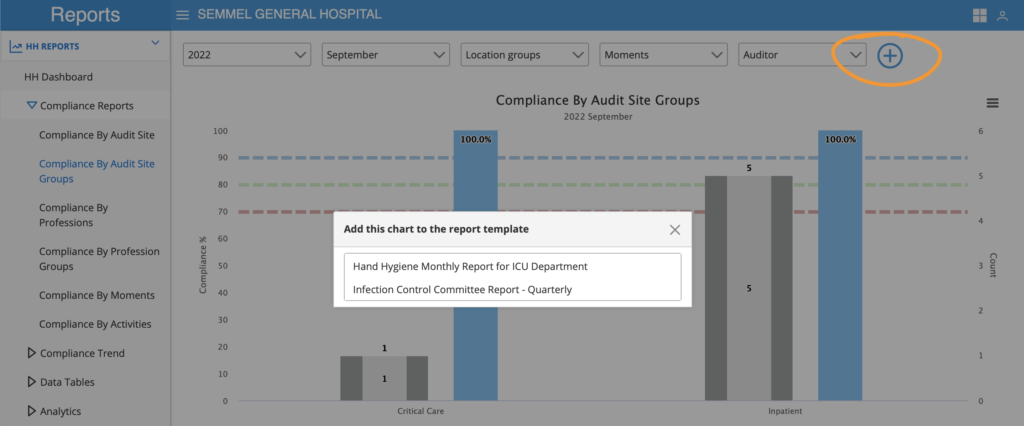
Auto Reporting
First, set up the system generate and send reports automatically. Follow the steps below:
Step 1: Select a template

Step 2: Click on Auto Reporting to launch the Auto Reporting dialogue box. You can see a list of all the charts that you have added to this Template.
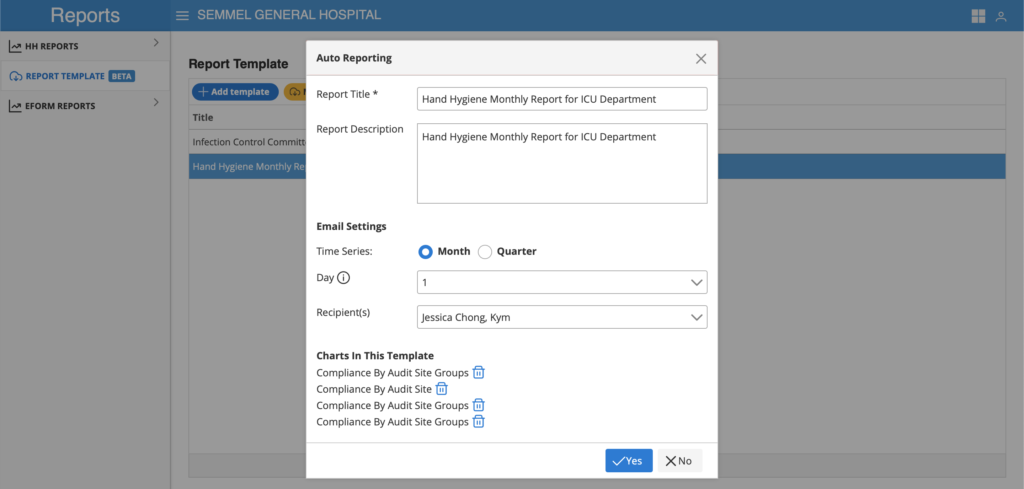
Step 3: You have a choice to send the report based on a Month or Quarter time series.
A Month time series chart will send compliance charts of the previous month. Example: If the current date is 5 July, the system will generate the compliance rate for the month of June.
A Quarter time series chart will send compliance charts of the previous quarter at the beginning of each quarter. This means that the system will send Q1 report in Apr, Q2 report in July, Q3 report in Oct and Q4 report in Jan (of next year).
Step 4: Select the day of the month to generate the report. If you select 3, then system will generate and send reports on the third of each month. If you select a Quarter time series, then system will generate and send report on the third day at the beginning of a new quarter.
Step 5: click “Yes” which will save the settings.
Manual Reporting
Step 1: Export monthly reports to PowerPoint.
These charts that you have set up in a template can also be exported manually into a single PowerPoint file.
i. Click on a template and then click Manual Reporting. A dialogue box will open

ii. Click on a template and then click Manual Reporting. One of the dialogue boxes below will open. If you do not have a Trend chart included in your report, then dialogue 1 will open. If you have a Trend chart included in your report, then dialogue 2 will open.
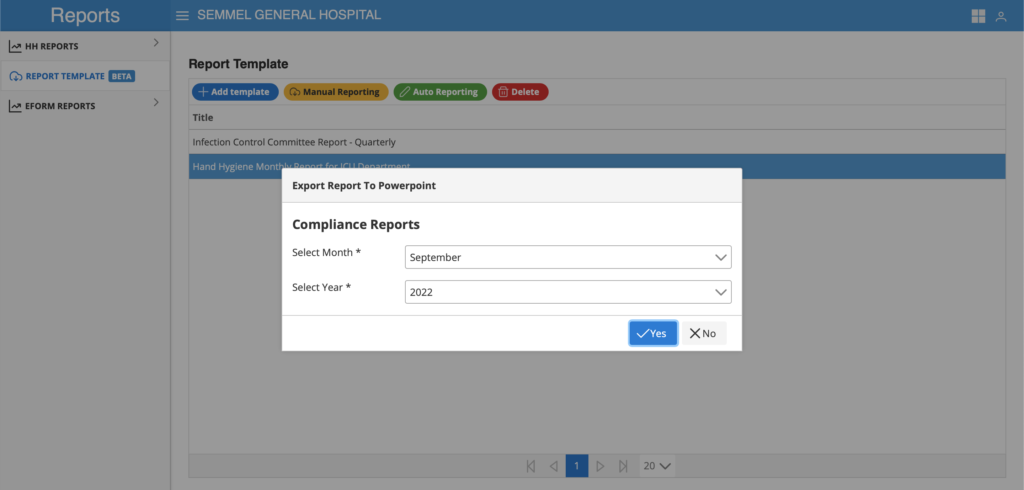
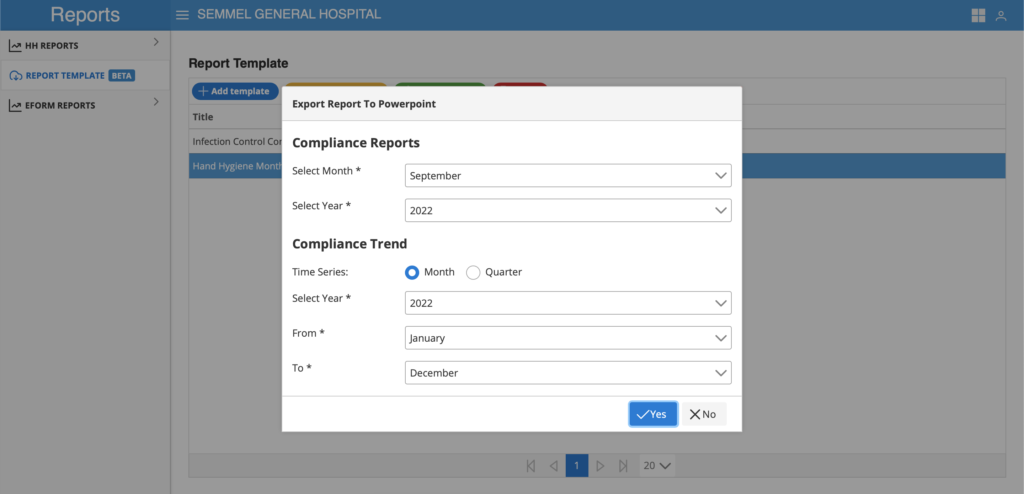
iii. Select the Month and Year of the report that you want to generate. Then click Yes. System will start generating the report and will be downloaded to your computer’s Downloads folder (or any other folder that you have set up in your computer to store downloaded files).
If you have a Trend chart included in your report, you will need to instruct the system to generate the type of Trend chart, either a Month or a Quarter trend chart. After that, select the year, start month and end month. Then click Yes to start generating the reports.
